India is currently battling the second wave of the Covid-19 pandemic, which has affected an estimated 30+ million people, with covid19India.org reporting close to 0.4 million deaths cumulatively. One widely adopted approach to combating Covid-19 infections has been restricting mobility. During the first wave of infections in India during March-May 2020, the Government of India implemented one of the most stringent lockdowns anywhere. This severely disrupted business activity and mobility, with millions of migrants traveling back to their villages as opportunities for work in the cities dried up.
The rationale behind implementing lockdowns is to curtail the spread of a contagion, and to reduce the consequent burden on the healthcare system to save lives. In addition, lockdowns may allow for quicker resumption of normal economic activity over time. However, the trade-off from lockdowns are short-run reductions in economic activity.
A lockdown potentially affects developing countries more as the practice of remote working is less prevalent and extent of digitisation is lower as compared to advanced economies. A larger share of households depend on daily incomes, and the social protection architecture is weaker. The 'graded unlock' in May and June 2020, when the central government decided to vary containment rules across districts in the country, provided a way for us to understand the impact from lockdowns. As questions regarding the impact of the ongoing second wave concern policymakers, we provide estimates of aggregate economic costs in the short run that a developing country could face from Covid-19 containment strategies.
How did zonal containment impact economic activity?
The Government of India announced a comprehensive nationwide lockdown on 25 March 2020, which was implemented uniformly across all states and districts. During this phase, nearly all offices, commercial and private establishments, industrial units, as well as public services were closed. Most transportation services – including international and domestic flights, railways, and roadways – were suspended. Hospitality services and educational institutions were shut. This nationwide lockdown lasted until 3 May 2020.
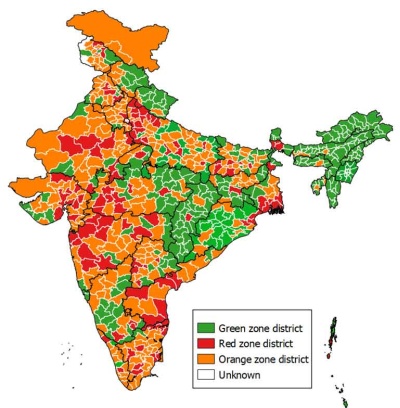 To facilitate a gradual resumption of economic activity, the government announced a differentiated unlock of districts, with three zone categories (130 districts as Red zone districts, 284 as Orange zone districts, and 319 as Green zone districts; see map). From 4 May 2020, districts were categorised based on multiple criteria including the incidence of cases, the extent of testing, and vulnerability to the pandemic. District-level mobile phone location data from Google and Facebook corroborated that these restrictions were indeed effective in reducing mobility as the government mandated.
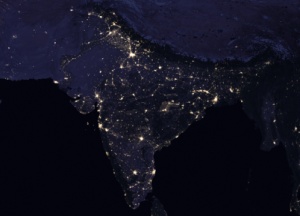
High-frequency, night-time light intensity is a commonly used proxy for aggregate economic activity. A detailed study by researchers from the World Bank found that night-time light intensity in India dimmed during the strict national lockdown in March and April compared to earlier months. By looking at how this varied during the months of May and June 2020, compared to the earlier uniform lockdown period, we can understand the impact of the lockdowns better.
Our central finding is that the economic recovery, as measured by night-time light intensity, was lower by 9.3 per cent in Red zone districts (where restrictions were maximum) relative to Green zone districts (with minimal restrictions). The same measure indicated that the recovery was 1.6 per cent lower in Orange zone districts compared to Green zone districts. These results are not driven by India's large metropolitan cities and hold even when these areas are excluded from the analysis.
We extended the analysis to examine the impact of the Red/Orange/Green zones on household-level consumption and income. Using monthly surveys of Indian households conducted by the Centre for Monitoring Indian Economy, we observe that lower household income and reduced consumption are important channels through which the zone-wise restrictions impacted night-time light intensity. Some districts were more impacted by the restrictions than others. More developed districts with above-median population density, share of employment in services, credit per capita, and average age, experienced larger impacts. These impacts also did not appear to depend on varying degrees of Mahatma Gandhi National Rural Employment Guarantee Act operations, nor on migrant shares after the lockdown.
Discussion
As India battles a second Covid-19 wave, which is also accompanied by viral mutations, state governments have imposed new mobility restrictions while trying to maintain economic activity. Our results suggest that the mix of state-wise lockdowns and micro-containment zones currently being implemented could lead to less-severe economic impacts than the enactment of a national lockdown. A closer look at lessons from the first wave indicate that district-specific characteristics like age, population density, and the share of the contact-intensive services sector, are also likely to determine the extent of the impact.
 |
 |
Our finding that household incomes declined more than consumption in 2020 points to the importance of maintaining livelihood while battling Covid-19. In this respect, public programmes that are targeted towards employment and income generation of low-skilled workers could potentially hedge against job losses and reductions in earnings.
A debate in many developing countries is whether public funds should be used to pay for vaccinations and public health expenditures. Our analysis points to the economic costs of containment measures to combat Covid-19, and so the costs of vaccinations and public health improvements should be weighed against those. Given the very high aggregate economic costs, most governments in developing countries would probably find that their investments in vaccinations and public health have more benefits than costs in the context of the Covid-19 pandemic.