In October 2014, India moved a step closer to international practices on colour coding the air quality in the cities – green is good, yellow is moderate, orange is poor, and red is worse. In technical terms, this is called the “Air Quality Index” (AQI) – a common denominator among a list of pollutants, with varying degrees of standards and varying levels of impacts on human health.
This is beyond doubt a landmark effort, realising the importance of making information public, in a form understandable to scientists and commoners alike.
How does AQI work?
The AQI is an "index" determined by calculating the degree of pollution in the city, as an average of the data from all the monitoring stations and for all the criteria pollutants. Each of the pollutants considered for these calculations has a prescribed national ambient standard, which is used to calculate individual index values that are later consolidated into one index value for the city.
Simultaneously, one can also establish the limiting pollutant (the most damaging of the pollutants measured) and estimate the AQI. Typically, the index is calculated using the ambient concentrations of six pollutants - particulates less than 10 micrometres in diameter (PM10), particulates less than 2.5 micrometres in diameter (PM2.5), sulphur dioxide (SO2), nitrogen dioxide (NO2), carbon monoxide (CO), and ozone.
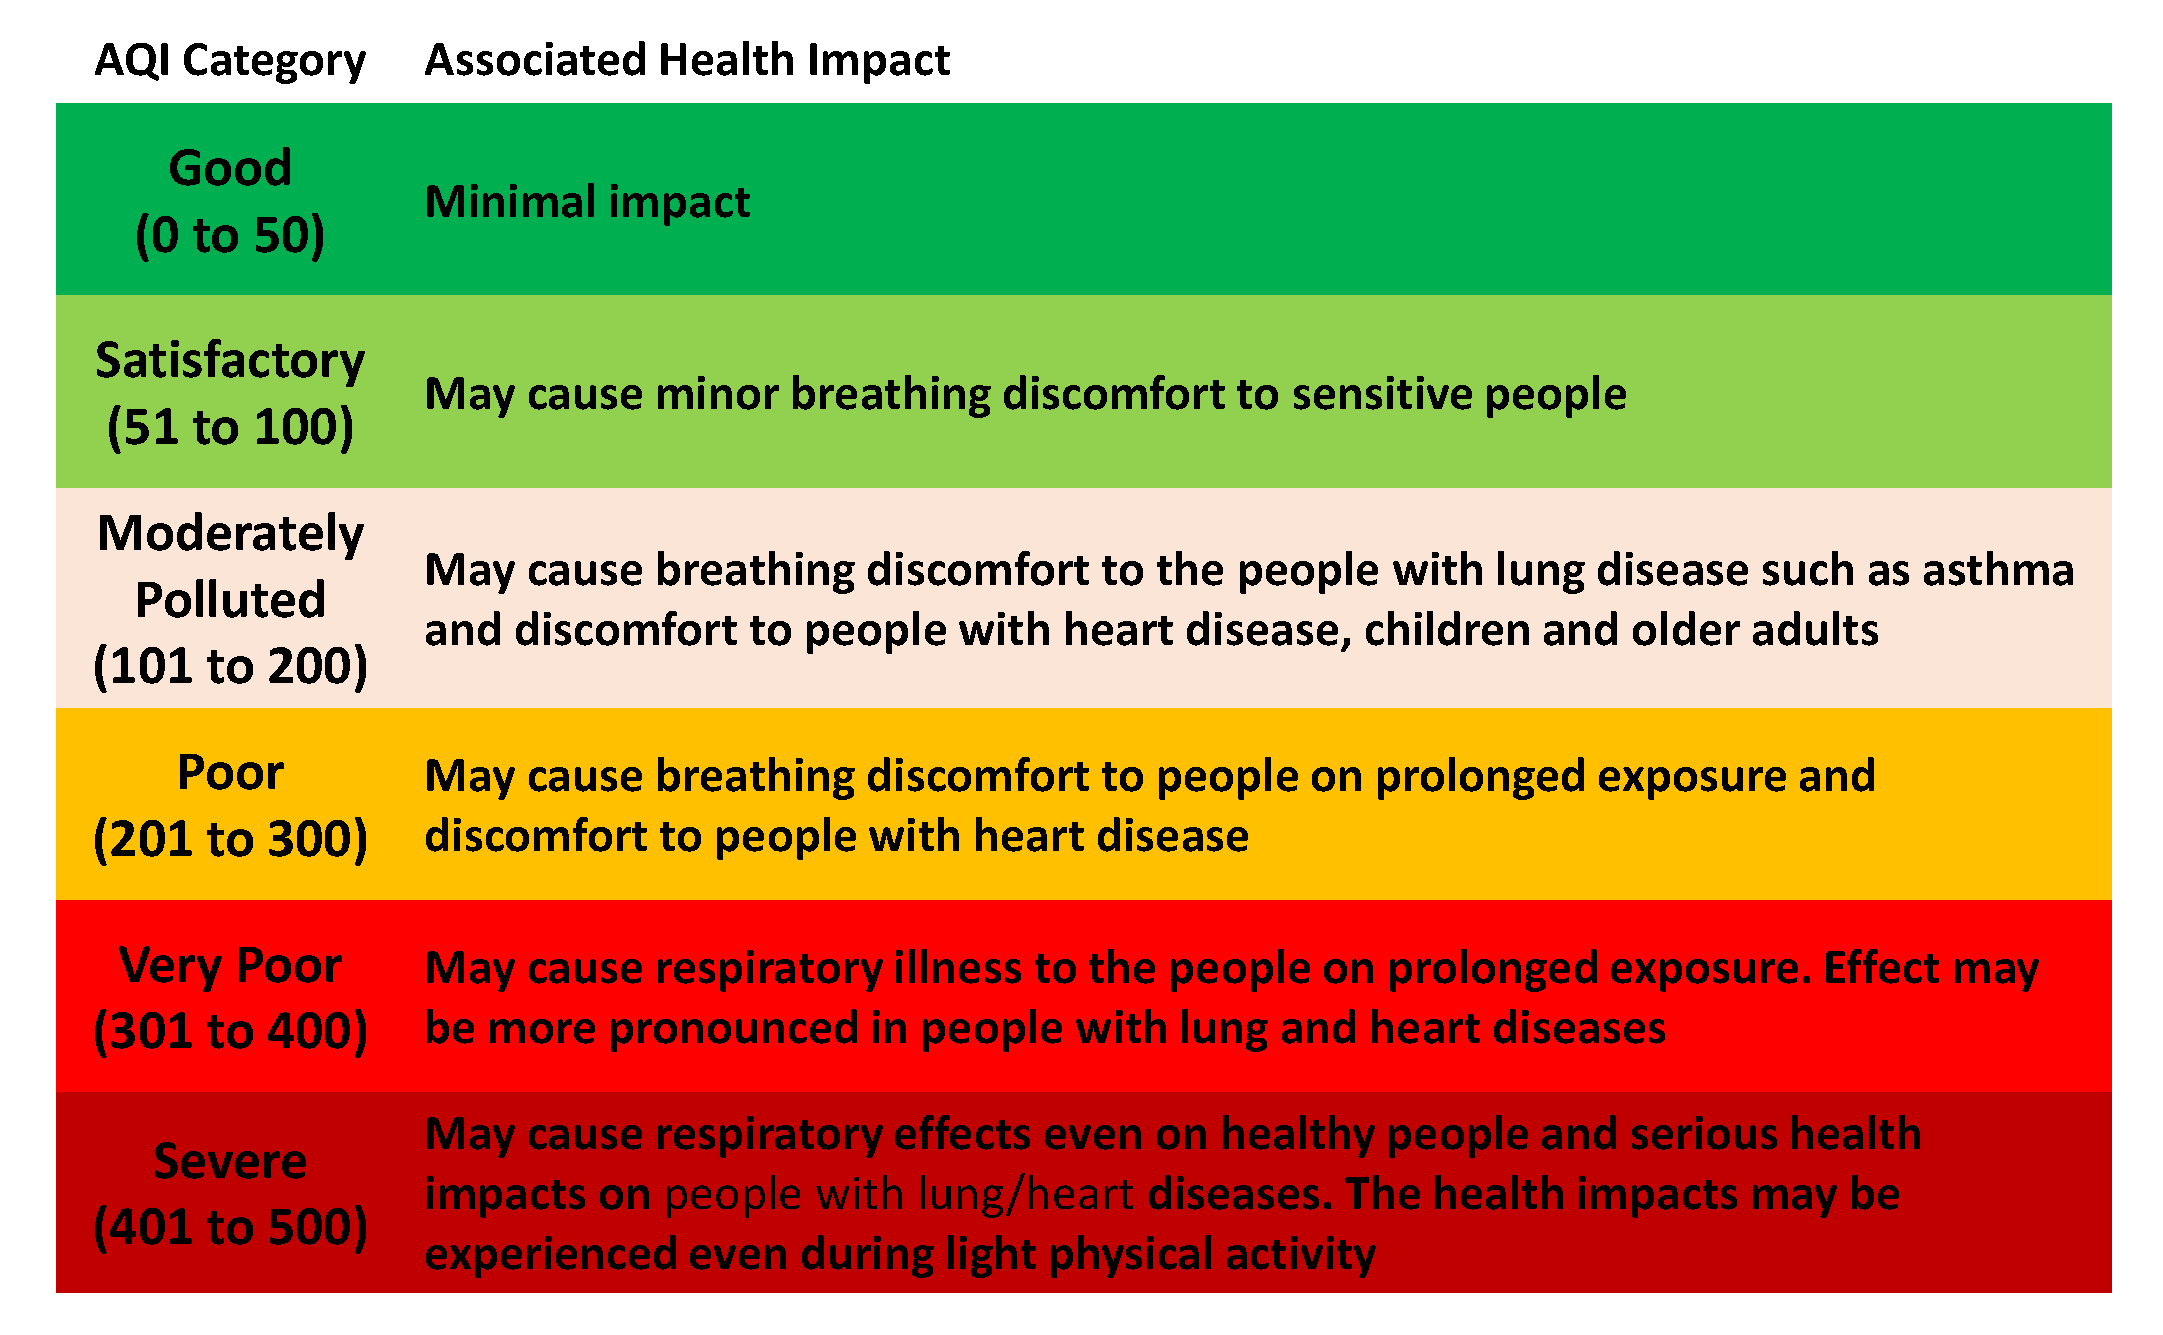
In numbers, AQI is represented between 0 to 500 with 0 representing good air and 500 representing hazardous air. The colour codes prescribed for use in India and their associated health impact warnings are as follows:
Some international best practices include those from the United States, the European Union, the United Kingdom, Hong Kong, Singapore, South Korea, France, China, and Thailand. While all these countries display and disseminate the AQI values in their respective cities to raise public awareness on air pollution, there are some differences in how they formulate the index calculations.
These differences stem from the fact that the background concentrations and the national standards are different and this has to be accounted for in the calculations locally.
What is amiss in India’s AQI system?
The transition from setting up monitoring stations to disseminating the information captured as a health alert to the public is a very welcome step. But now, while the direction is set, the path is yet to be laid out for effective implementation of the system. Here is why.
To support the regulatory and compliance assessments based on the ambient standards, the national ambient monitoring program (NAMP) monitors PM10, SO2, and NO2at more than450 locations covering more than cities. Today, the AQI system is being deployed to the cities using this data, which is collected every 24 hours, but only 2-3 times per week. This means that most often either the AQI will be listed as “data not available” or calculated using limited amount of information.
On the other hand, only a handful of cities operate continuous air monitoring stations (CAMS), with limited access to the data in real time. If we look at the best practices listed above, all these countries operate CAMS, with public access to the data in real time, all 7 days of the week. The number of stations operating in their respective cities is also more than those one would find in India.
For example, Beijing with 21 million inhabitants operates 35 CAMS compared to Delhi, which has 22 million inhabitants and operates only 11 CAMS. While more cities are coming under the NAMP program, there is an immediate need to overhaul the monitoring program by converting the manual protocols to CAMS, if the AQI program is to function as an effective health alert system in India.

Besides the typical six pollutants, India’s AQI system includes two more pollutants - Lead (Pb) and Ammonia. This only complicates the idea of a simple AQI, for two reasons.
The first is related to chemistry – when we are considering PM10 and PM2.5, these pollutants are a mixture of primary and secondary contributions. The primary portion of PM is the direct emissions from anthropogenic sources in the cities, ranging from vehicle exhaust, road dust, industries, garbage burning, to construction activities.
The secondary portion of PM comes from chemical reactions between “ammonia and SO2” and “ammonia and NOx” forming sulphates and nitrates, which in their aerosol form are part of PM. This means that the contribution of ammonia is taken into account in PM concentrations and listing it exclusively as a criteria pollutant for AQI amounts to double counting.
The second reason is related to the frequency of monitoring lead and ammonia concentrations. The NAMP stations are manually operated and measure only PM10, SO2, and NO2. Even the limited numbers of CAMS, measuring the full array of criteria pollutants, do not include lead. This translates to “data not available” for at least half of the pollutants on the list necessary to calculate the city average AQI.
Lead pollution is very critical and can be harmful even in very small doses. This was the very reason for introducing unleaded gasoline nationwide in 2000 and adopting the European template for fuel quality standards, creating parallel "Bharat" standards. While it is important to show that the impact of these interventions is in fact evident, it is not necessary to list the same among the criteria pollutants to be measured and assessed on a daily basis.
The reporting format of the AQI is currently posthumous. This means that only after the data from the NAMP stations is collected and archived is it converted into an index and reported for the city. This information will then be posted on CPCB’s website and also made available for media services to report, which will be useful for historical archiving.
All the international practices are designed to report air quality information as a daily/hourly index in real time, so that a health alert can be issued in real time to take precautions. The proposed frequency of reporting in our case cannot result in any such advisories or be linked to any short-term actions, which is one of the immediate uses of an AQI system.
For example, in March 2014, air pollution levels in Paris reached the highest levels of alert on their scale. Immediately, an ordinance was passed allowing either odd or even numbered registered vehicles on a given day. The measure was temporary, in place only for a week, till the pollution levels and AQI score were back to acceptable levels. Implementing such actions in real time in Indian cities, even at a day’s notice, will be difficult. However, the least one can expect is an alert to the public in real time, in order to enable them to take necessary precautionary measures for better health.
Lastly, most of the manual stations and the CAMS are located close to a residential area or close to a traffic junction, which is not a true representation of the air pollution in the city. There is an immediate need to address the monitoring placement protocols to capture a mix of residential, industrial and transportation sources in the air quality information.
The Way Forward
According to the 2011 census, 2774 rural settlements have now been reclassified as urban settlements, pushing the total to 3894. The urban population is expected to grow from 30 percent to 50 percent by 2030, and the expected growth in industrial, transportation, domestic, and power generation sectors will consequently result in an increase in emissions and air pollution for almost all Indian cities.
According to the World Health Organization (WHO), 37 cities from India feature in the top 100 cities with the worst PM10 pollution in the world. A similar assessment by the WHO in 2011, listed 27 cities in the top 100. If “clean India campaign” also means cleaner air in these urban settlements, we need to revolutionise the way air quality information is collected and the way air quality is managed in the cities, now and in the future.
The information dissemination procedures in India are currently in embryonic phase and need to be developed from many angles, so that they may become comparable to international practices. As a way forward, these are the key sectors where the protocols need some immediate attention, not only to support the public awareness activities, but also to support the enforcement of the environment regulations in various sectors:
- All the NAMP stations, currently using manual protocols, must be upgraded to report air quality in real time using CAMS
- The NAMP program, which currently covers 150 cities, must be expanded to all the urban settlements
- The number of monitors in each of the cities must be increased (at least 3-4 times) to truly represent the mix of the air pollution sources
- The information collected from the stations must be disseminated in real time via web portals and mobile services
- The air quality information must be collected in a fashion suitable for producing health alerts in real time and the same used for creation of public awareness and pollution management
By having an information management system such as the AQI, we are a step closer to achieving a balanced air quality management system in India, albeit with two challenges ahead: achieving good nationwide continuous air quality monitoring and an effective information dissemination programme.